Description
Correlation Trend Indicator is a study that estimates the current direction and strength of a trend. It can be used to detect trend outbreaks or exhaustion. Correlation Trend Indicator uses Spearman correlation when estimating how closely the behavior of close prices correlates with a positive-slope straight line. This means that:
- Values close to +1.0 signify uptrend conditions.
- Values close to -1.0 signify downtrend conditions.
- Values around 0.0 signify sideways-trend conditions.
Input Parameters
| Parameter | Description |
|---|---|
length
|
The projected trend length. |
Plots
| Plot | Description |
|---|---|
R
|
The CorrelationTrendIndicator plot. |
ZeroLine
|
The zero level. |
Example*
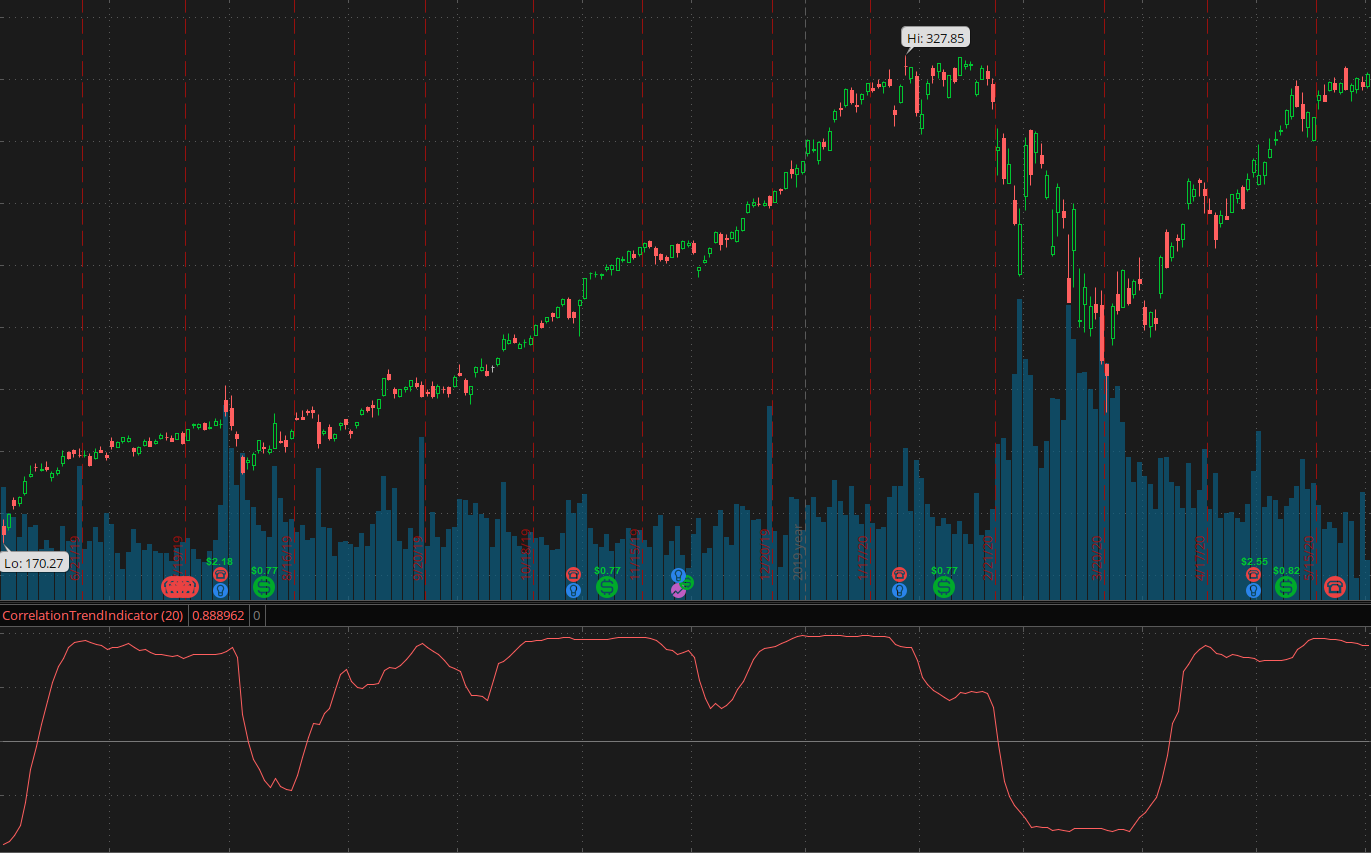 *For illustrative purposes only. Not a recommendation of a specific security or investment strategy.
Past performance is no guarantee of future performance.