Description
The Correlation Cycle Market State is a visualization of the state that the market is currently in: uptrend, downtrend, or cycle mode. This indicator only returns three values: +1 (uptrend), -1 (downtrend), and 0 (cycle mode). The market state is based on the values returned by the Correlation Cycle Angle study. Cycles longer than a certain amount of bars are considered trends.
Input Parameters
| Parameter | Description |
|---|---|
length
|
The presumed wavelength. |
trend length
|
The maximum amount of bars in a cycle. |
Plots
| Plot | Description |
|---|---|
MarketState
|
The market state as calculated by the Correlation Cycle Angle study: +1 (uptrend), -1 (downtrend), or 0 (cycle mode). |
Example*
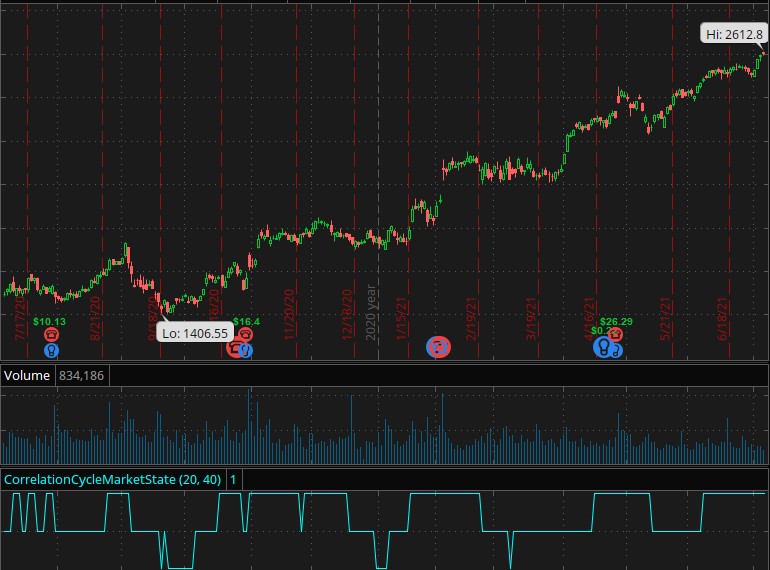
*For illustrative purposes only. Not a recommendation of a specific security or investment strategy.
Past performance is no guarantee of future performance.