StDev ( IDataHolder data , int length );
Default values:
length: 12
Description
Returns the standard deviation of data for the last length bars.
General Information
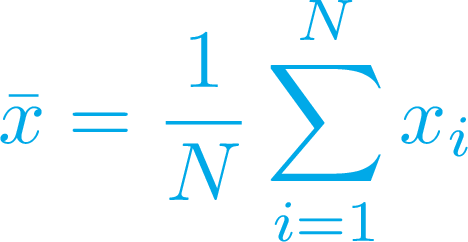
Standard deviation measures how widely values range from the average value. Standard deviation is calculated as a square root of variance, which is the average of the squared deviations from the mean.

Input parameters
| Parameter | Default value | Description |
|---|---|---|
| data | - | Defines the variable for which the standard deviation is calculated. |
| length | 12 | Defines the period on which the standard deviation is calculated. |
Example
script StDevTS {
    input data = close;
    input length = 12;
    def avgData = Average(data, length);
    plot StDevTS1 = Sqrt( (fold i = 0 to length with SD do SD + Sqr(GetValue(data, i) - avgData) ) / length);
    plot StDevTS2 = Sqrt(Average(Sqr(data), length) - Sqr(Average(data, length)));
}
declare lower;
input length = 10;
plot StDev1 = StDev(close, length);
plot StDev2 = StDevTS(close, length).StDevTS1;
plot StDev3 = StDevTS(close, length).StDevTS2;
The code draws three plots that show the standard deviation for the close price of the current symbol on the defined period. The StDev1 plot is based on the built-in function, the StDev2 and StDev3 plots are based on its thinkScript® implementation, using two different mechanisms of calculation. All the three plots coincide, forming a single plot.