Description
AnchoredVWAP is a variation of the VWAP study that uses an anchored date to calculate the volume-weighted average price of a security. By analyzing cumulative VWAP data from the initialization point onward, it validates how a price has evolved and allows to pinpoint specific market events.
AnchoredVWAP uses date annotation to define the study’s starting date. To change it, right-click any timestamp in the chart area or use the built-in date picker.
If you want calculations to reset daily, weekly, or monthly, use the VWAP study.
Input Parameters
| Parameter | Description |
|---|---|
num dev dn
|
The number of deviations defining the distance between AnchoredVWAP and the lower band. |
num dev up
|
The number of deviations defining the distance between AnchoredVWAP and the upper band. |
begin date
|
The starting date used for the calculations. |
Plots
| Plot | Description |
|---|---|
VWAP
|
The VWAP plot. |
UpperBand
|
The upper band plot. |
LowerBand
|
The lower band plot. |
Example*
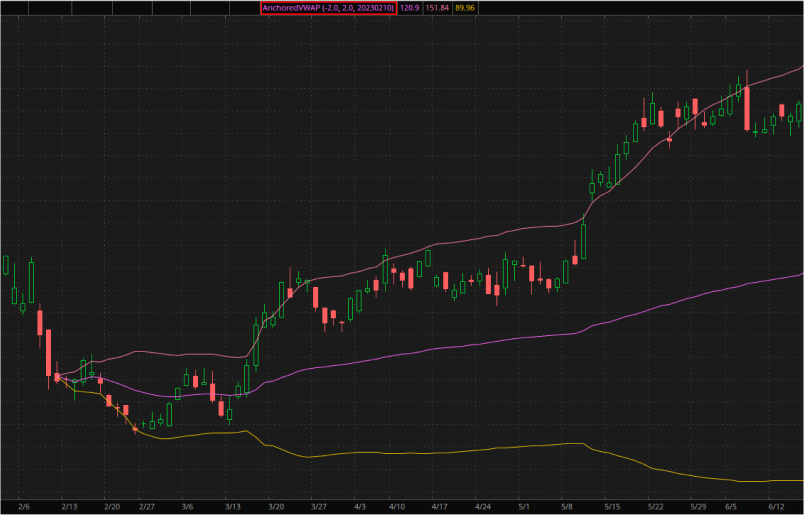
*For illustrative purposes only. Not a recommendation of a specific security or investment strategy.
Past performance is no guarantee of future performance.