
Description
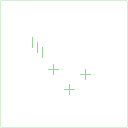
TriStar is a trend reversal candlestick pattern consisting of three Doji candles. A bullish trend reversal can be predicted after a downtrend when the second Doji gaps down from the first and the third candles. In uptrend, a bearish reversal is recognized when the second Doji gaps up from the first and the third candles.
Input Parameters
| Parameter | Description |
|---|---|
length
|
The number of candles used to calculate the average body height. If the body height of a candle is less than 5% of this average, it is considered a Doji candle. |
trend setup
|
The number of preceding candles to check if the trend exists. |
Plots
| Plot | Description |
|---|---|
Bearish
|
The bearish TriStar candlestick pattern. |
Bullish
|
The bullish TriStar candlestick pattern. |
For educational purposes only. Not a recommendation of a specific security or investment strategy.
Technical analysis is not recommended as a sole means of investment research.
Past performance of a security or strategy does not guarantee future results or success.